Why Model?
Modeling is fundamental to imaging, and I hope to convince you that modeling and migration are identical,. If you know how to do one, you know how to do the other. Consequently, it is extremely important that you understand how to synthesize seismic responses that are as close as possible to what we physically measure in the real world.
Determining Reflector Location
Before computers, simple straight-ray methods were used to determine the important parameters involved in figuring out the true sub-surface location of recorded reflected events. Figure 2 demonstrates the process.
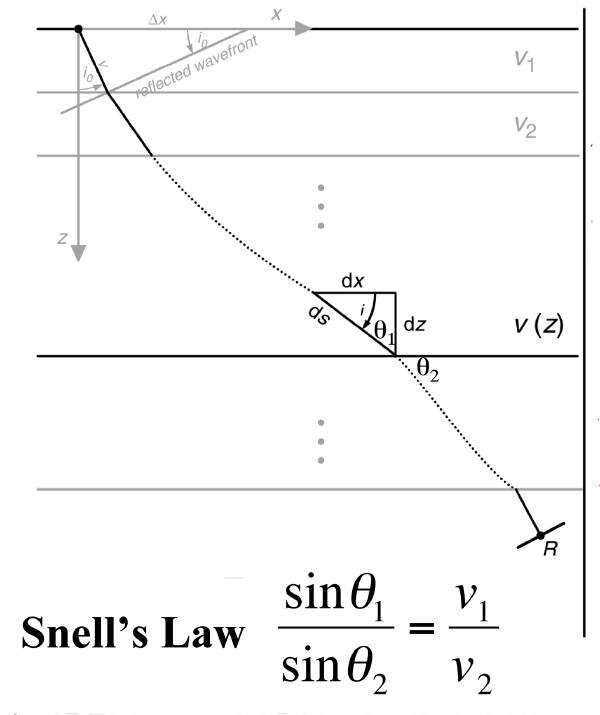
Computing the ray direction from one layer to the next requires adherence to Snell's law, Equation 1 or Equation 2
 | (1) |
 | (2) |
Thus, the only required elements for this form of modeling are the ability to compute the sine of angles, a ruler, and perhaps a protractor. What is important is that for a given source on the surface the normal incident ray that travels from the source to a reflector and back to the source-receiver location is uniquely determined by either the dip of the reflector or by the takeoff angle at the surface. As we will see, this particularly simple concept is fundamental to both migration and modeling. We can estimate what we call apparent dips from seismic sections, and then compute the true dip of the reflector, along with a given velocity. Simultaneously, we can compute the surface distance from the given shot point to the surface projection of the subsurface reflector location, thereby constructing a "migrated" image.
Geologic Complexity
Perhaps the earliest and one of the most compelling reasons for modeling was presented by Frank Rieber's in his 1936 Geophysics paper. Quoting Rieber:
The usual form of reflection seismograph operates satisfactorily over simple structural conditions, but frequently fails to obtain part or all of the desired information when structures are steeply folded, faulted or otherwise complicated. The reasons for this are plainly evident if the paths of the waves in the earth can be visualized.
We immediately recognize that what he is saying when the geology is simple, the reflection seismogram is easy to unravel, but when the geology is complex, it is difficult. He is also saying that if we can model complex structures, we may be able to better understand the problem and then develop technologies to resolve it. From my perspective, the most amazing thing is that he proceeds to do exactly that:
This has been done by the use of a technique originally developed for acoustical measurements.
A new type of equipment and technique are briefly described, with which exploration may be carried into the more complex structural regions successfully.
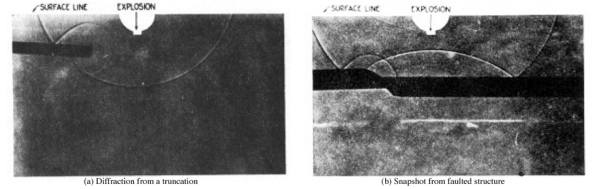
A miniature explosion radiates waves into various models of structure, where reflection and diffraction take place in the same manner as in the earth. The various moving waves are actually photographed in flight. A series of plates is presented, showing wave patterns in various types of structures, ranging from simple to complex.
Briefly, the technique is one of shadow photography, no lens of any sort being employed. A bright electric spark, lasting only about one millionth of a second, is spaced about four feet from a photographic plate. The model of the structure to be investigated is placed part way between the spark and the plate, in such a position that its shadow will be photographed.
If no sound waves are present in the field between the light source and the plate, the shadow of this model will be the only thing shown in the photograph. The rest of the field will be uniformly exposed to the light from the spark and will correspondingly show uniform photographic density.
If an abrupt sound wave happens to be passing through the field, however, the light from the spark will be bent slightly at the places where it passes through the denser air of the wave front. This bent light will be superposed upon other illumination arriving directly on the plate from the spark, thereby causing a dark line. The part of the plate from which the bent light was diverged will show, correspondingly, as a lighter line.
Thus, Rieber explains why he thinks modeling is important, and then proposes a solution to both the modeling and the visualization problem. The why in Rieber's case is to figure out how to interpret seismic shot records that were considered uninterpretable at the time. In the 1930's, tedious hand calculations were the only available methods for placing an event on a shot record at its correct (or nearly correct) subsurface position. These early migration methods were not well suited to positioning anything but simple reflected events. While the response of a syncline was not difficult to unravel, what Rieber's paper showed was that the so-called no record zones were in reality areas with even moderately complex geology. Salt structures of the size and shape we see today were generally figments of the imagination.
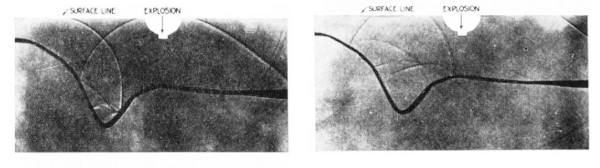
Figure 3 demonstrates the validity of Rieber's shadow method. Figure 3(a) shows that the response of a truncation in an otherwise constant velocity medium is a diffraction. This is a circular event that could have easily confused the typical inexperienced interpreter of the day. Part (b) shows the downward traveling wave on the edges along with the reflected wave in the center for a faulted structure. Note the clear diffractions on the left-hand side of this graphic. It is one of several similar Rieber graphics that clearly demonstrate the success of his technique. The left half of this figure shows a snapshot of the response from a syncline at some time after the explosion at the center of the image. The right half is a snapshot at a later time. What we see, particularly on the top half of Figure 3, is the characteristic bow-tie reflection from the syncline.
(a)
Reiber's
snapshots
of
the
response
of
truncated
structures.
(b)
Reiber's
snapshots
of
the
response
of
a
syncline
|
At the time of Rieber's research, the complexity of the seismic response was not well understood, and,
consequently, detecting or even recognizing dip on these records was problematic. Figure
4 shows that Rieber
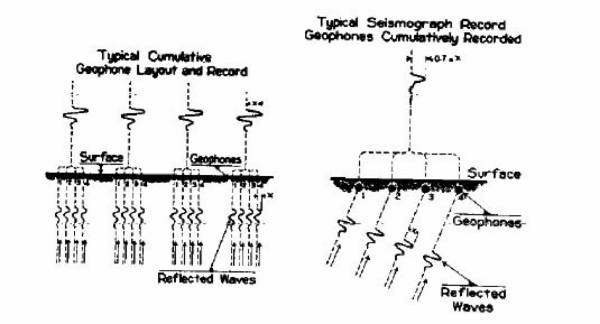
understood this as well, and formulated a method for more or less automatic detection of the associated
dips. It represents what is believed to be one of the first ever utilization's of what is now called slant
stacking. Note that it is applied to a shot record and really detects the angle at which the given reflection
emerges. The dip detector first estimates the emergence angle of a reflected wavefield at the receiver
locations, which can be computed from
 =
=
 . Given the emergence angle and the velocity of the
wavefield (which was assumed constant in Rieber's day), we can directly calculate the location and
dip of the reflector from which the wavefield came. As we will see in later chapters, this emergence
angle data and the directly related subsurface dip are crucial in all modern migration methodologies.
. Given the emergence angle and the velocity of the
wavefield (which was assumed constant in Rieber's day), we can directly calculate the location and
dip of the reflector from which the wavefield came. As we will see in later chapters, this emergence
angle data and the directly related subsurface dip are crucial in all modern migration methodologies.
Hypothesis Testing
A more modern reason behind data synthesis is what can be called hypothesis testing. An example of this is displayed in Figure 5. The left hand side of this figure is an arbitrary line slice taken through a 3D prestack depth migration of a seismic data set from the Gulf of Mexico survey. It was chosen to be as close as possible to a true dip line. The right graphic is an image constructed from 2D isotropic elastic data synthesized over a 2D structure constructed from the 3D migration velocity field along with top and base salt interpretations.
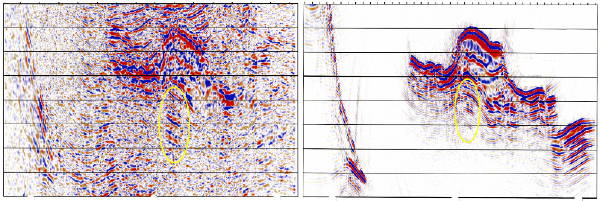
When mapped in 3D, the circled amplitude package appears to define a stacked set of hydrocarbon bearing reservoirs with significant potential. Thus, the hypothesis in this case is that the package is a valid prospect. To test this hypothesis, a 2D acoustic Earth model was constructed. The model velocity was taken to be the migration velocity with a top and base of salt used to define the salt body. Although not shown, the model includes shear velocities below the water layer, and, consequently, some converted waves have been imaged on the section.
The right side of Figure 5 shows the result of the modeling under the assumption that the surface of the water is not reflective. Thus, any repetitive events cannot be from water column multiples. The clear evidence of multiple amplitudes in a setting where such amplitudes cannot be due to the water layer, confirms the hypothesis that the amplitudes are from peg-leg multiples or converted ray events.
There are, of course, many other ways to utilize modeling to answer various hypotheses that are not directly related to verifying that some event or anomaly is noise. We can also build models to compare various alternative model parameters in an attempt to quantify observed amplitude versus offset or amplitude responses. In a subsequent section on full waveform inversion, we will demonstrate the importance of low frequency acquisition in the specification of the earth velocity field.
Acquisition
An important recent utilization of modeling by Carl Regone at BP dealt directly with trying to verify that wide azimuth acquisition is superior to narrow acquisition. What these studies showed was that, as actually assumed by the mathematics, wide azimuth acquisition produces superior results in all settings.
- Introduction
- Seismic Modeling
- Primary Concerns
- Three Earth Models
- Seismic Acquisition: The Basic Idea
- Why Model?
- Waves and Wavefields
- The Scalar Wave Equations
- Stress-Strain Equations
- Algorithms
- Variational Formulation and Finite Elements
- Finite Differences
- Model Boundaries
- Fourier Based Methods
- A Word About Sources
- Huygens Principle and Integral Methods
- Raytracing
- Raytrace Modeling
- Zero Offset Modeling
- History
- Zero Offset Migration Algorithms
- Exploding Reflector Examples
- Prestack Migration
- Prestack Migration Examples
- Data Acquisition
- Migration Summary
- Isotropic Velocity Analysis
- Anisotropic Velocity Analysis
- Case Studies
- Course Summary
