BP 2004 Salt Structure Data
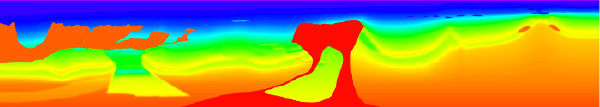
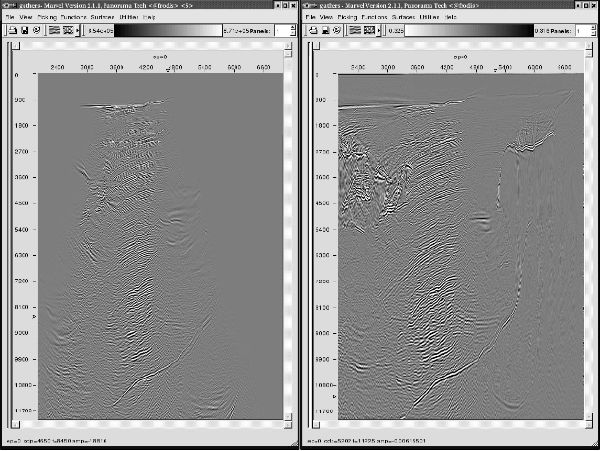
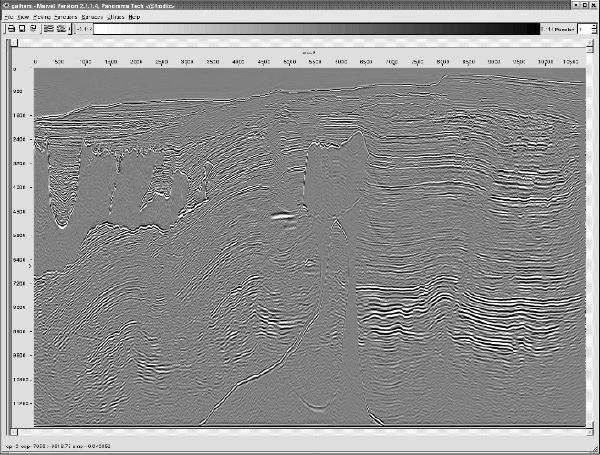
Figure 7(a) is a graphic of the velocity model for the Earth model used to generate realistic data for evaluation of imaging techniques. This model is very complex, with lateral velocity ratios close to 2:1 at many depth levels. Part (b) of this figure compares two partial images. The image on the left in part (b) was obtained from a one-way method, while the image on the right is a two-way image using exactly the same parameters and input data. Clearly, the two-way method images much more of the subsurface than does the one-way method. This is very likely because the two-way method produces a much more accurate impulse response at all angles. Part (c) shows that the two-way method can provide an excellent response even without multiple suppression.
(a)
BP
2004
Model
after
F.
Billette
(b)
One-way
versus
two-way
on
the
same
input
data
|
- Introduction
- Seismic Modeling
- History
- Zero Offset Migration Algorithms
- Exploding Reflector Examples
- Prestack Migration
- Prestack Migration Examples
- Common Azimuth on the SEG/EAGE C3-NA Synthetic
- Kirchhoff versus One-Way on a Gulf of Mexico 2D Salt Synthetic
- A North Sea Sill Synthetic
- Marmousi Case Study
- An Imaging Note and the BP 2.5 Dimensional Data
- BP 2.5 D Data
- BP 2004 Salt Structure Data
- SEG AA' Data Set
- Migration from Topography
- The SMAART JV Sigsbee Model
- SMAART JV Pluto Data Set
- SEG/EAGE C3-NA Data Imaging
- Anisotropic Earth Models
- Data Acquisition
- Migration Summary
- Isotropic Velocity Analysis
- Anisotropic Velocity Analysis
- Case Studies
- Course Summary
