Shot Profile Hand Migration in Three Dimensions
Dipping events are usually from three dimensional reflectors. Figure 21 shows one possible approach to figuring out the 3D nature of reflections from dipping events by recording into orthogonal receivers. The idea is to measure and use apparent dips in crossline and inline directions as we did in Figure 6 to estimate the distance and direction of the migrated position from the current one.
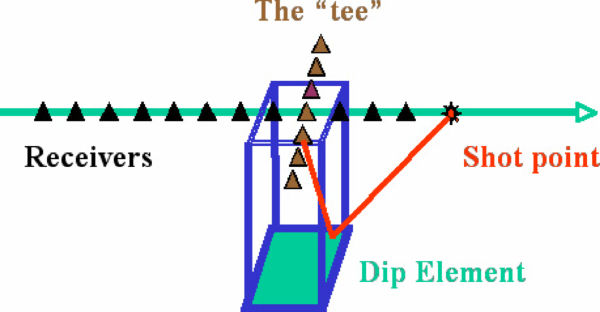
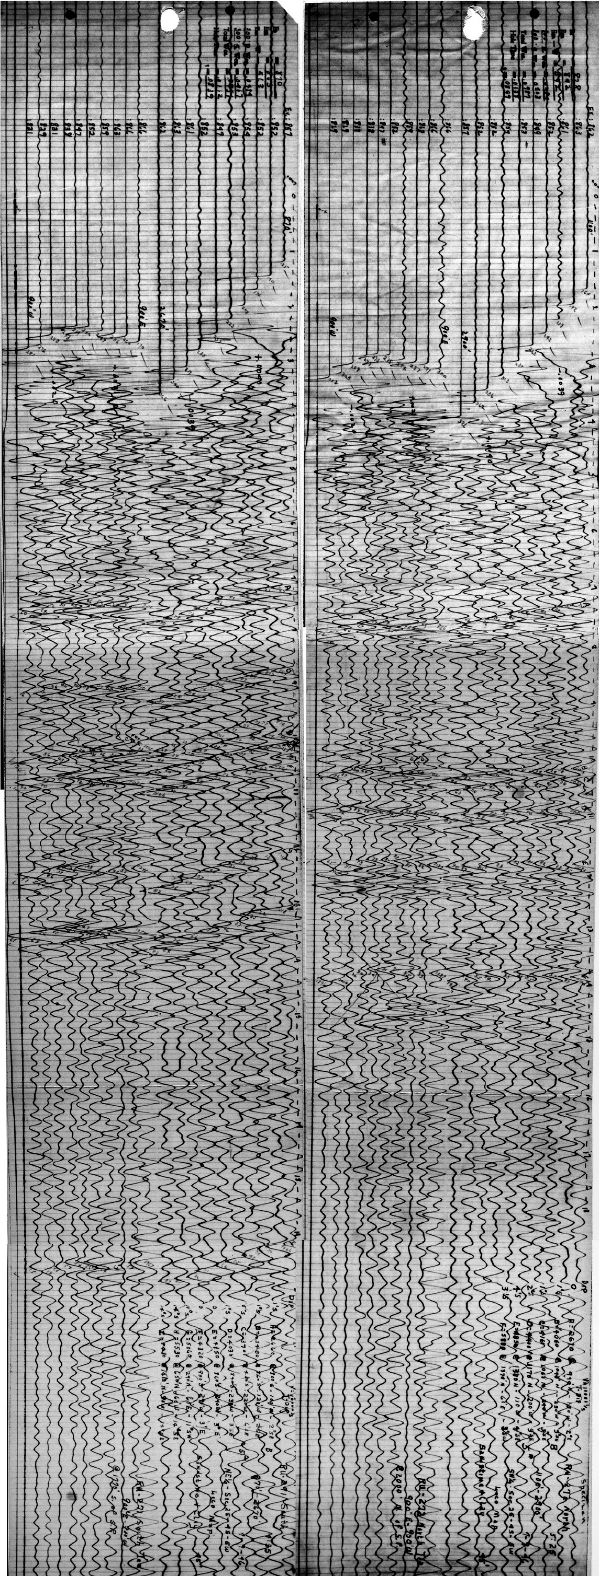
Figure 22 shows two late 1940's vintage Amerada Petroleum seismic records showing a "single-end shot record" and what they called a "tee" record for determining the parameters for the calculations described in previous figures. The right-hand side of each record is the single ender while the left-hand side represents the "tee". This kind of cross-spread shooting foreshadowed acquisition of seismic data using orthogonal shot and receiver lines.
|
Figure 23 shows the simple mathematics of locating the source of the reflected event when there is dip in the x and y directions. This is a 1940's vintage description of how Amerada Petroleum's scientists approached the problem. This kind of solution was considered a top-secret technology in all oil companies of the day.

- Introduction
- Seismic Modeling
- History
- Data Acquisition
- Zero Offset Hand Migration
- Shot Profile Hand Migration in Two Dimensions
- Curved Rays
- Shot Profile Hand Migration in Three Dimensions
- Remarks about Migration
- Redundant Data
- Swing Arms
- Non-Zero Offsets
- Stacking and DMO
- Historical Summary
- Zero Offset Migration Algorithms
- Exploding Reflector Examples
- Prestack Migration
- Prestack Migration Examples
- Data Acquisition
- Migration Summary
- Isotropic Velocity Analysis
- Anisotropic Velocity Analysis
- Case Studies
- Course Summary
