Gulf of Mexico Salt Model
Figure 6 shows a typical Gulf of Mexico salt structure with associated zero-offset exploding reflector synthetic data. The play here is in the beds that terminate at the salt-sediment interface. The geology is such that, except for the salt-sediment interface, velocity variation is relatively small.
However, from an imaging point of view, the extreme 2:1 or even in some cases 3:1, velocity contrast between the sediment and the salt represents a very difficult problem for most imaging algorithms to handle. The challenge is to image the salt face and the corresponding sediment terminations. The Gulf of Mexico salt structure has some of the steepest dips of all the models considered in this section. We should expect reverse time migration to win this contest easily.
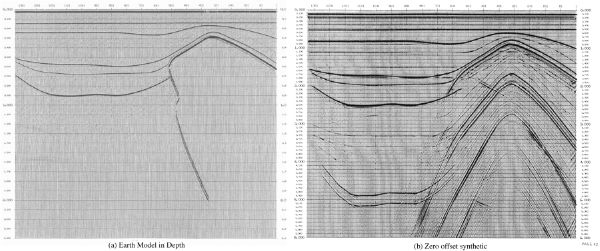
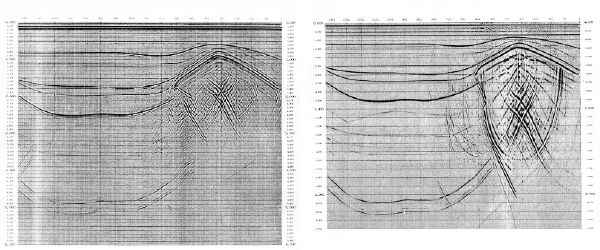
Figure 7 compares phase shift migration versus two-way reverse time migration. As we will see, regardless of which migration algorithm we use, the reverse time approach does the best job of placing all the events at their proper location. Unlike its time-domain based counterparts, it places all events as close as possible to where the velocity model says they should be.
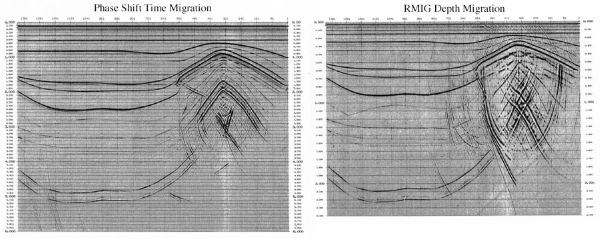
Figure 8 compares 45 degree migration versus two-way reverse time migration. From a purely esthetic point of view, we could argue that the 45 degree migration on the left is superior to the reverse-time migration on the left. One reason for this is the inherent dip-filtering that the 45 degree limit produces. Dips beyond 45 degrees are essentially lost, so the salt face will never be properly imaged, but because they are lost, the image looks much cleaner.
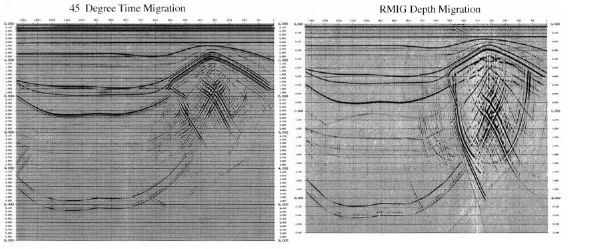
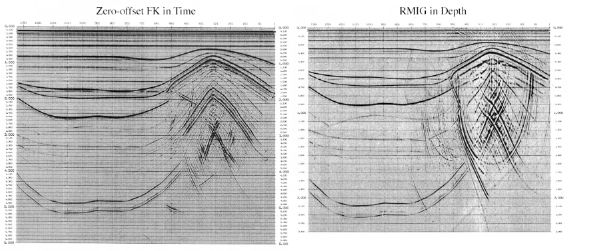
Figure 9 compares FK migration versus two-way reverse time migration. Because it is so sensitive to the constant velocity assumption used to derive it, an FK migration has no chance of imaging the salt face at its proper position. What is more surprising is that the salt face is almost not imaged at all.
The cascade migration does a very nice job on this zero-offset data set. We can argue that it is in fact the best of all the time-migration results. Nevertheless, the image is not nearly as good as the two-way graphic on the right.